Explore Topics (Beta)
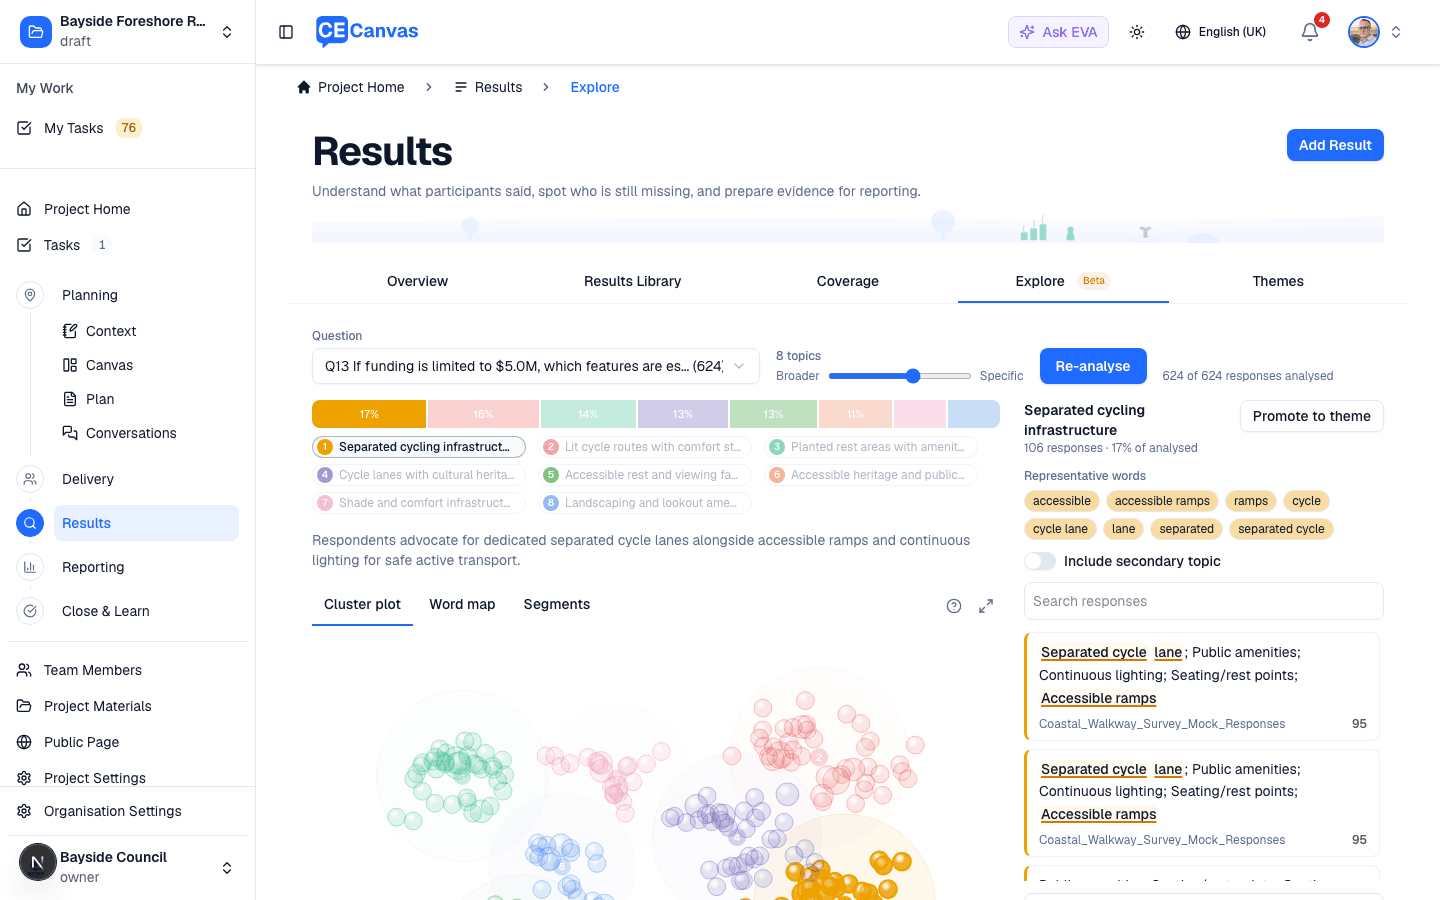
Explore answers the question every consultation ends with: what are thousands of free-text responses actually saying? It groups responses by meaning into a set of topics you control, names each topic, shows how big each one is and who raised it, and keeps every verbatim response one click away — so the pattern and the evidence stay together.
From the project sidebar, go to Results → Explore.
Explore vs Themes: Explore is a fast, re-runnable way to discover what’s in the responses — run it as often as you like, with different questions or topic counts. Themes is your curated, durable set. Nothing in Explore changes your themes until you explicitly promote a topic.
Before you start
Explore works on the free-text answers inside results you’ve already added and analysed (see Results). You need at least 20 free-text responses in the selected scope. Questions with fewer than 20 qualifying responses remain visible but cannot be selected. Questions whose answers are really categories in disguise (“Prefer not to say”, “Yes/No”) aren’t offered — they’re distributions, not topics.
Running an analysis
Three controls, one button:
| Control | What it does |
|---|---|
| Question | Which question’s answers to analyse. Defaults to the question with the most responses; All questions analyses everything at once. Switching questions re-analyses automatically. |
| Topics slider | Roughly how many topics to find, from Broader (a few big themes) to Specific (up to 12 finer ones). There’s no wrong setting — re-run until the groupings feel right. |
| Analyse / Re-analyse | Runs the analysis in the background. Your current view stays usable until the new result lands. |
The first run on a large consultation can take a few minutes. Re-running the same question with a different topic count is usually much faster because its responses have already been read. A question you have not analysed before may take longer on its first run.
Very large consultations are sampled: above 5,000 responses, Explore analyses a representative sample and says so — for example “Analysed a representative sample of 5000 of 6493 responses (capped at 5000)”.
Reading the results
The page has two panels: the plot and its alternate views on the left, and a rail on the right that always shows the selected topic — its representative words, then the responses themselves.
Topic chips and the share bar — every topic gets a number and a name; the share bar above shows each topic’s slice of the responses (hover a chip for its exact percentage). Click a chip (or anything else carrying the topic’s colour) to focus that topic everywhere at once; click again to clear. A one-sentence summary of the selected topic sits below the chips.
Representative words — the words and phrases that most distinguish the selected topic, shown as tinted chips at the top of the responses rail (stronger tint = more distinctive). Click a word to highlight it in the responses below.
Cluster plot
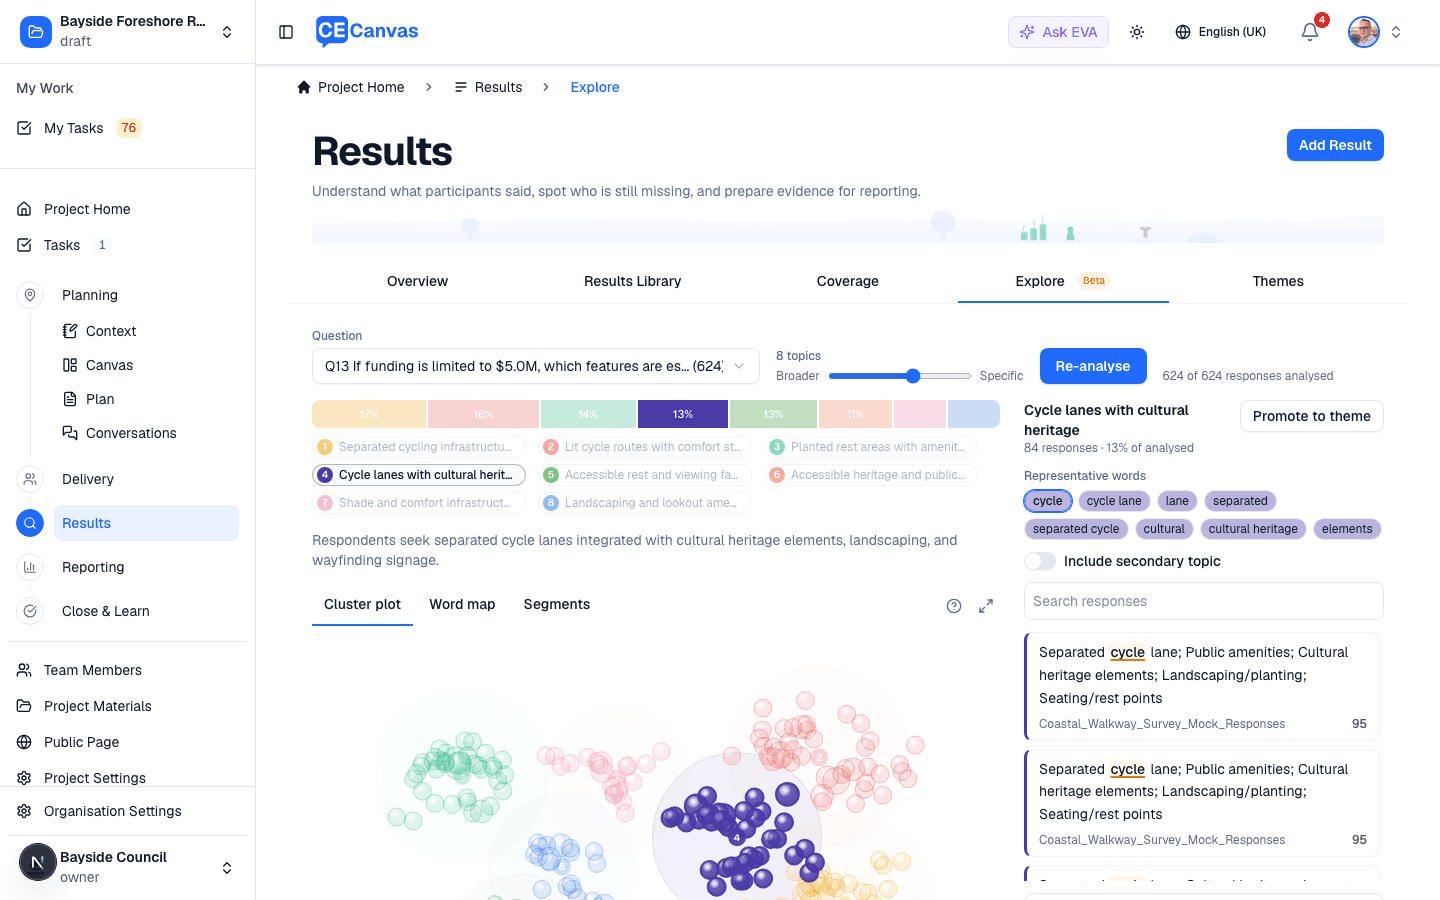
Each bubble is a group of responses — bigger bubble, more responses saying the same thing. Bubbles gather around their topic’s numbered centre; responses closest to the centre are the most typical of the topic, and related topics sit near each other. If two clusters blur into one, they probably cover a single theme — try a broader topic count and re-analyse.
- Click a bubble to select its topic; hover to preview a response and see how many the bubble contains.
- Scroll to zoom, drag to pan, double-click (or Reset view) to zoom out.
- The expand control (⤢, top right of the plot) opens the plot near-fullscreen when you want to read the cluster structure in detail — selection carries back to the page.
- The help control (ⓘ, beside expand) recaps how to read the plot and links back to this page.
Word map
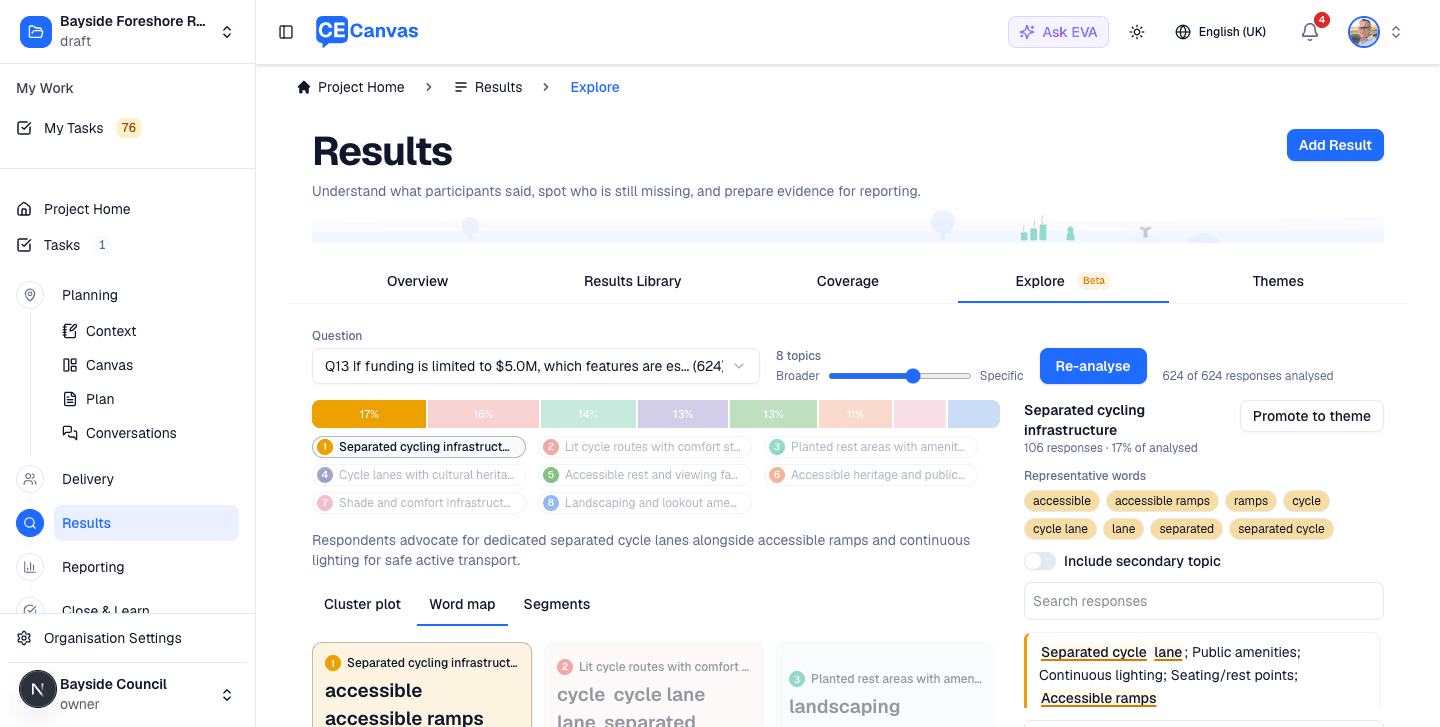
The whole consultation’s vocabulary on one screen — one card per topic, terms sized by how strongly they characterise it. Useful as a first scan and as a report visual.
Segments — who is saying what
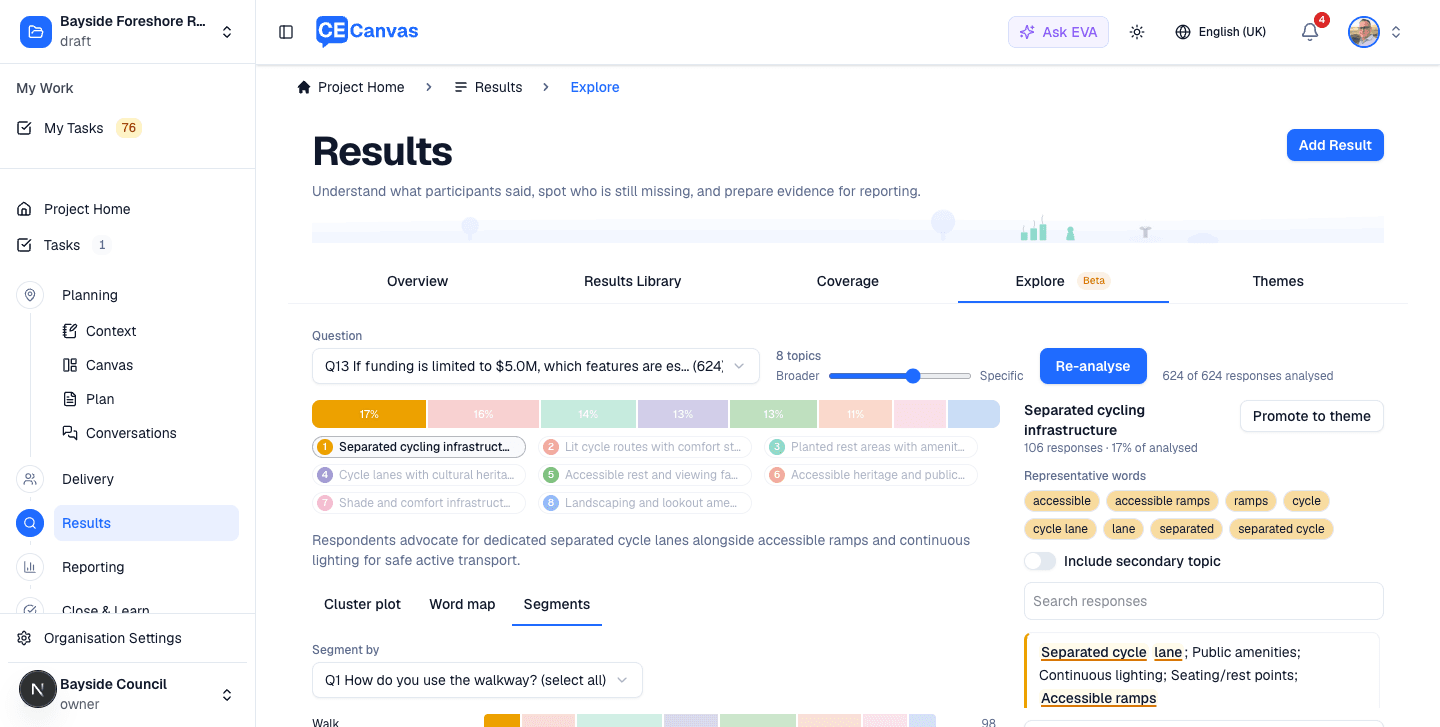
If your survey captured respondent details (suburb, age group, and so on), Segments breaks each group’s responses down by topic. This is the view that turns “parking came up a lot” into “parking dominates for 35–44s in Seaholme” — pick the detail to segment by, and click any bar segment to focus that topic.
The responses behind every topic
The right-hand rail is the selected topic’s home: its representative words up top, then the actual responses, most typical first, with the topic’s key terms highlighted. Each card shows its source result and a 0–100 score for how strongly it belongs.
- Search filters within the current topic (or all responses when nothing is selected).
- Include secondary topic also lists responses whose second-closest topic is the selected one — useful when a response genuinely spans two topics.
A response belongs to its closest topic — treat topics as a well-organised reading guide, not an exact count.
Promoting a topic to a theme
Found a topic that matters? Promote to theme adds it to your project’s Themes with its responses linked as evidence. Identical answers from the same result are linked once rather than duplicated. From there it behaves like any other theme: edit it, merge it, use it in reporting.
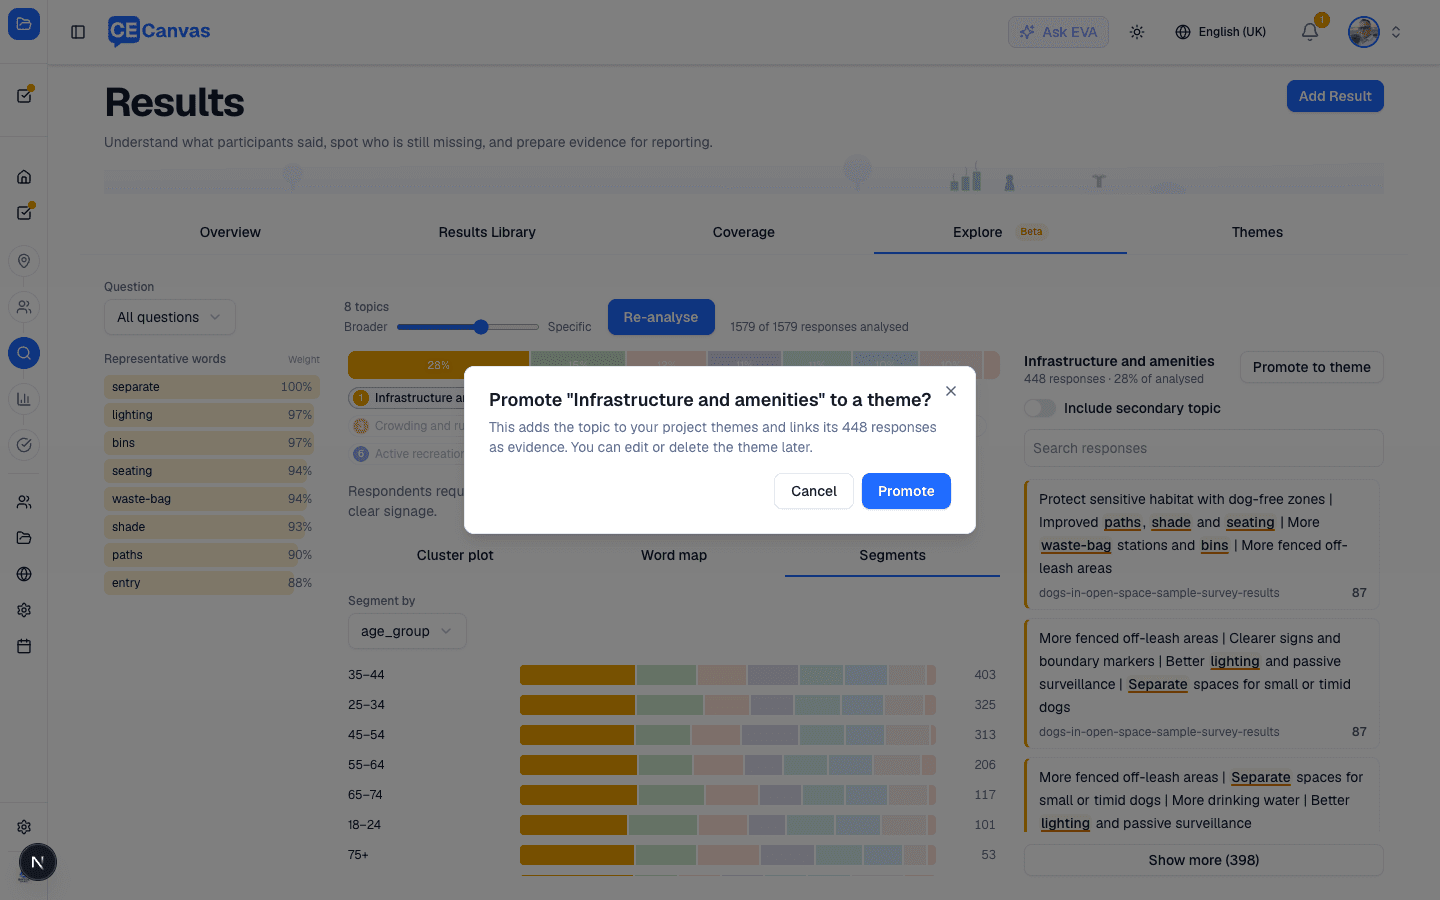
Promotion is one-way and explicit: exploring, re-running, and changing topic counts never touch your themes.
How it works (and what to trust)
Explore reads every response and groups them by meaning, not just shared words — “nowhere to park” and “parking is impossible” land in the same topic. Topic names and summaries are AI-written from the actual responses; the shares, counts, and segment breakdowns are computed directly from your data. Clustering is designed to be repeatable while the underlying embedding and AI models stay the same, although AI-written topic names and summaries can vary slightly between runs.
Because it’s exploratory (and in Beta):
- Treat topics as a lens for reading, not final coding — the codeframe in Themes is where curated analysis lives.
- Different topic counts slice the same responses differently. That’s a feature — try a broad pass first, then a specific one.
- If AI naming is ever unavailable, topics still appear, named by their key words, and you can re-analyse later.